The JavaScript library Chart.js is an open source project created by Nick Downie in 2013.
ChartJS is a library-based on javascript and HTML5. The main foundation of this library is <canvas> element in HTML5.
A great way to get started with charts is with ChartJs, a JavaScript plugin that uses HTML5’s canvas element to draw the graph onto the page. It’s a well documented plugin that makes using all kinds of bar charts, line charts, pie charts etc.
ChartJS is a powerful, dependency free JavaScript library which builds graphs via the canvas element.
The great things about ChartJs are that it’s simple to use and really very flexible.
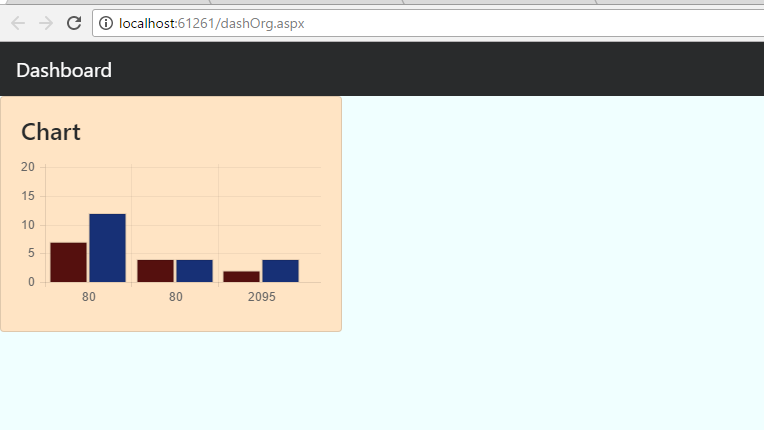
Here I want to share the steps to display a barchart in my MVC application.The value of chart will vary based on the provider and date filter.
ChartJS Basics
ChartJS uses the canvas element. The basic pattern is to create the canvas element in HTML, select it with JavaScript, and create the Chart while passing in the data the chart is built from.
We can customize the ChartJs library to create whatever chart you visualize. The library provides six basic designs by default.
- Line: Show your data as the peaks and valleys of a line graph.
- Bar: Demonstrate trends with many different shaped bars.
- Radar: Present data just like your local meteorologist.
- Pie: Present data as slices of the overall circle.
- Polar area: It’s easier to quote the documentation on this chart as it is similar to pie charts. The variable isn’t the circumference of the segment, but the radius of it.
- Doughnut: Think of a pie chart that is presented in a doughnut shape. The inner circle or hole in the middle is customizable.
The base of everything is the Chart object, which contains methods for creating and manipulating the chart types. Using the Chart object is a simple process. The following steps provide the basic approach to creating charts using the library.
- Include the Chart.js library in the web page.
- Create a Canvas element within the web page.
- In script, obtain the context of the Canvas element.
- Assemble data to be used to fill the Chart.
- Create the chart via script — pass context element to Chart and individual methods to create chart type (data and options passed via method).
The features and advantages chartjs.
- 100% responsive, so we do not have to worry and think about the look of our apps on all devices.
- 6 Chart type. We do not have to worry about running out of stock chart type, and our application will be perfect
- The size is only 110KB and free library dependencies with other libraries
- Fully tooltip, so that we can display a short information.
- Etc.
SETTING UP
The first thing we need to do is download ChartJs. Then create a new html page and import the script:
DRAWING A BAR CHART
The first thing we need to do is create a canvas element in our HTML in which Chart.js can draw our chart. So add this to the body of our HTML page.
I’ll be using the CDN to include the library – using this script tag
https://cdnjs.cloudflare.com/ajax/libs/Chart.js/2.1.4/Chart.min.js
Need to add Canvas in our page.
<div>
<canvas id="chartcanvas"></canvas></div>
Similarly we can create different types of charts
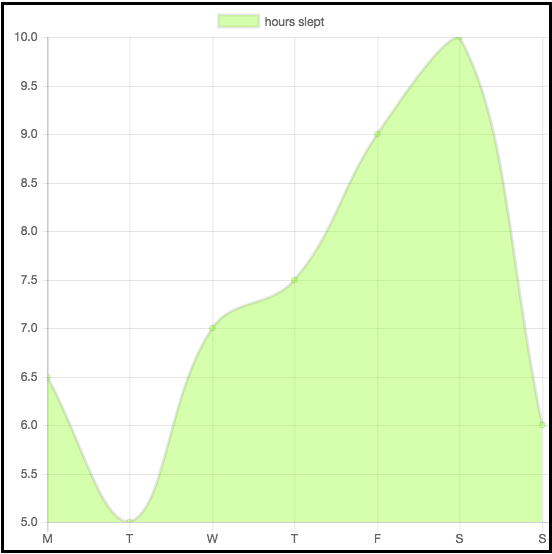
LINE CHART
var ctx = document.getElementById('myChart').getContext('2d'); var myChart = new Chart(ctx, { type: 'line', data: { labels: ['M', 'T', 'W', 'T', 'F', 'S', 'S'], datasets: [{ label: 'hours slept', data: [6.5, 5, 7, 7.5, 9, 10, 6], backgroundColor: "rgba(153,255,51,0.4)", }] } });
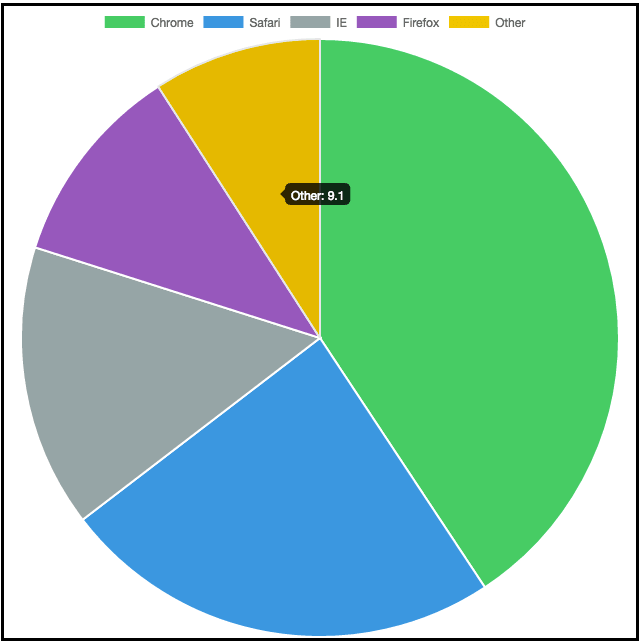
PIE CHART
var ctx = document.getElementById('myChart').getContext('2d'); var myChart = new Chart(ctx, { type: 'pie', data: { labels: ['Chrome', 'Safari', 'IE', 'Firefox', 'Other'], datasets: [{ backgroundColor: [ "#2ecc71", "#3498db", "#95a5a6", "#9b59b6", "#f1c40f" ], data: [40.7, 23.9, 15.3, 11, 9.1], }] } });
LEARN MORE……..
There is so much more to learn about Chart.js.You can also check out the Chart.js homepage for more information about what it is and what you can do.
THANK YOU!!!!!!!!!
