Project documentation with DOXYGEN

Doxygen is the standard tool for generating documentation from annotated C++ sources, but it also supports other popular programming languages such as C, Objective-C, C#, PHP, Java, Python, IDL (Corba, Microsoft, and UNO/OpenOffice flavors), Fortran, VHDL, Tcl, and to some extent D.

Doxygen can help you in three ways:

  1. It can generate an on-line documentation browser (in HTML) and/or an off-line reference manual from a set of documented source files. It also support for generating output in RTF (MS-Word), PostScript, hyperlinked PDF, compressed HTML, and Unix man pages. The documentation is extracted directly from the sources, which makes it much easier to keep the documentation consistent with the source code.
  2. We can configure doxygen to extract the code structure from undocumented source files. This is very useful to quickly find our way in large source distributions.
  3. Doxygen can also visualize the relations between the various elements by means of include dependency graphs, inheritance diagrams, and collaboration diagrams, which are all generated automatically.

Doxygen is developed under Mac OS X and Linux, but is set-up to be highly portable.It runs on most other Unix flavors as well, executables for Windows are available.

Step 1.

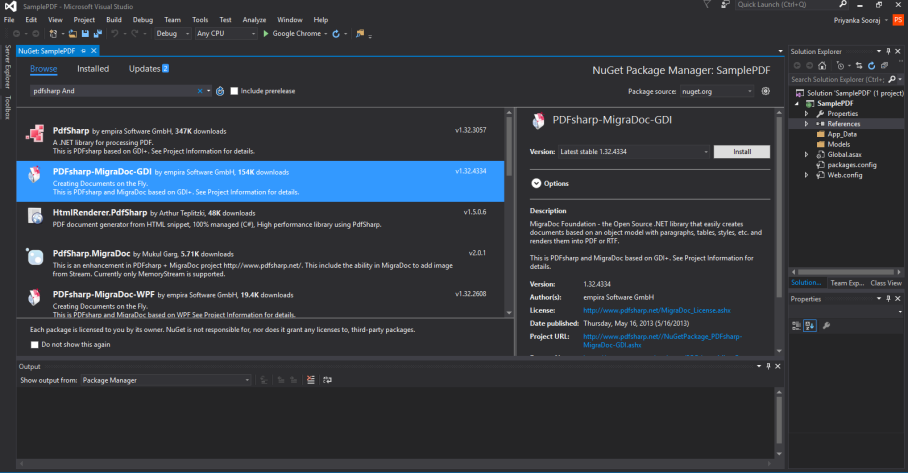
Install doxygen in your machine.We can get the link from the site.Here i have used this

doxygen-1.8.13-setup.exe.

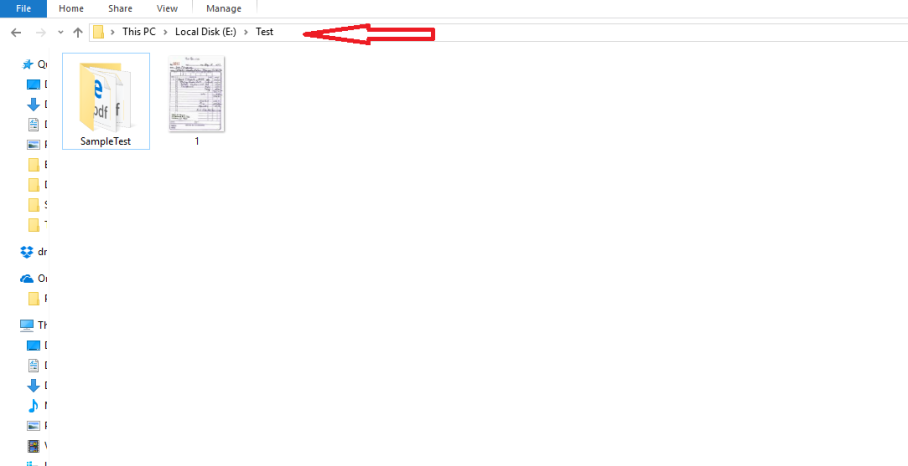
Step2: Create a folder for saving the documents .

Step3: Keep your source code ready.

Step4:Execute doxygen.

After installation select Doxywizard .
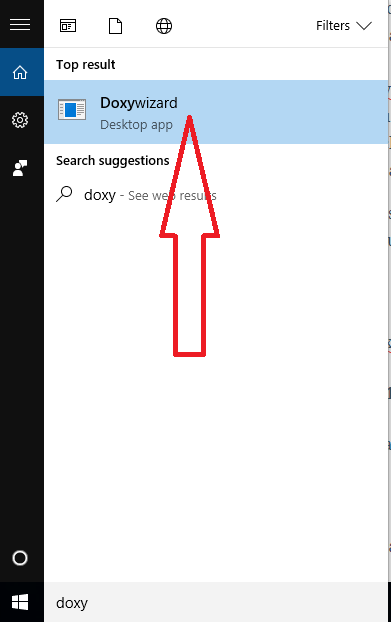
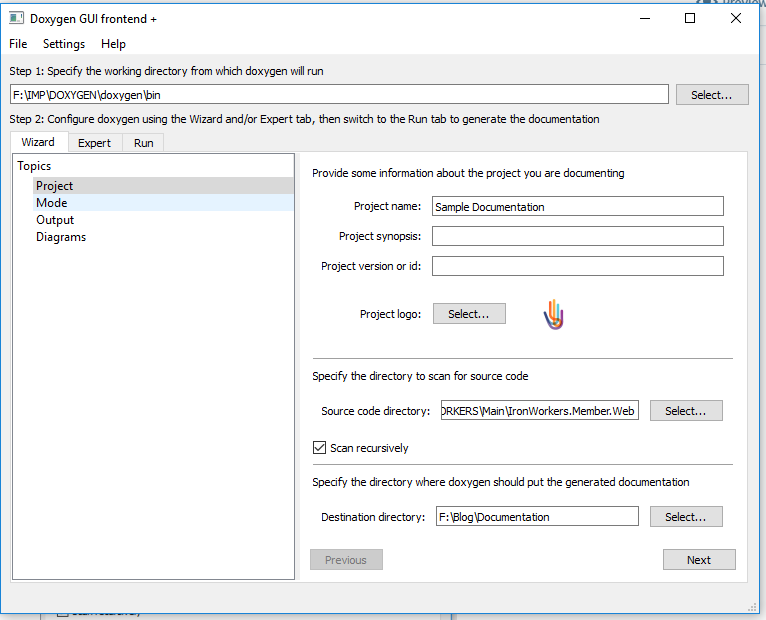
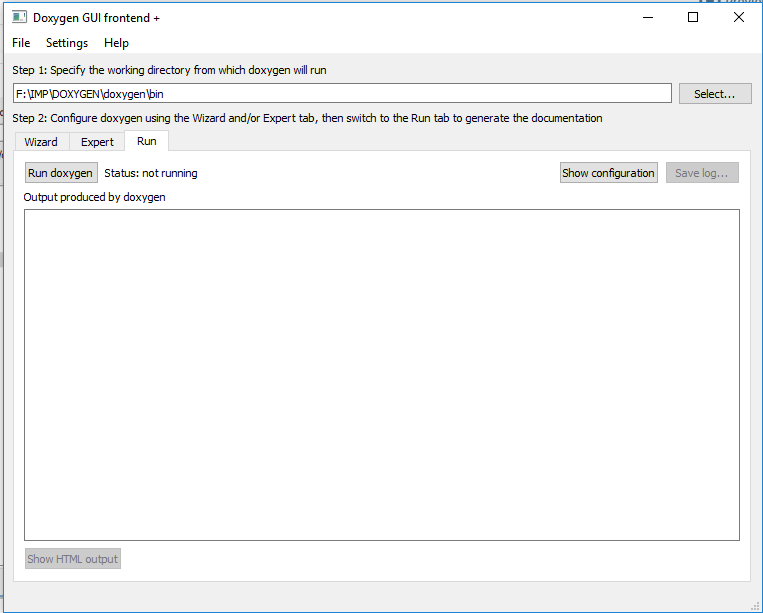
Doxygen_1

Open doxywizard.

Doxygen_2

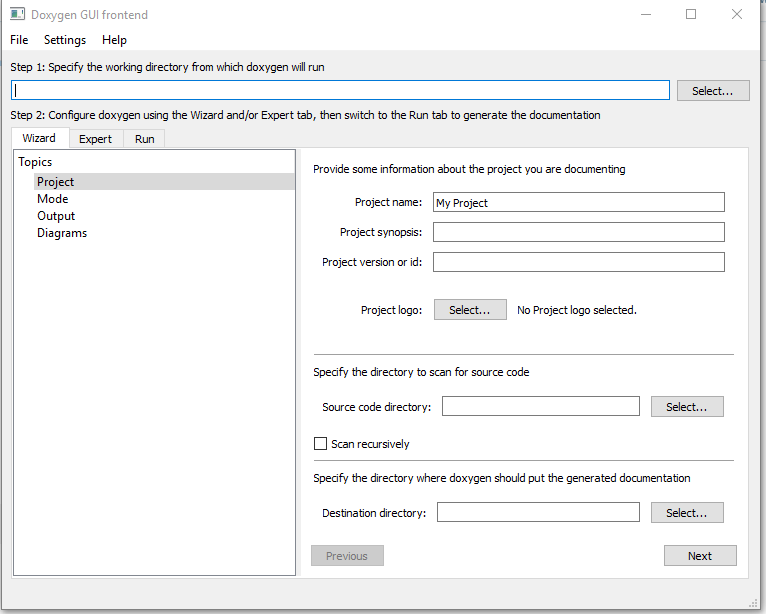
In this we can specify the path of doxygen by selecting  the bin folder of doxygen.

In the project name field you can type the name which you want to display in documentation,also insert logo,source code directory,destination directory etc.

Dox_4

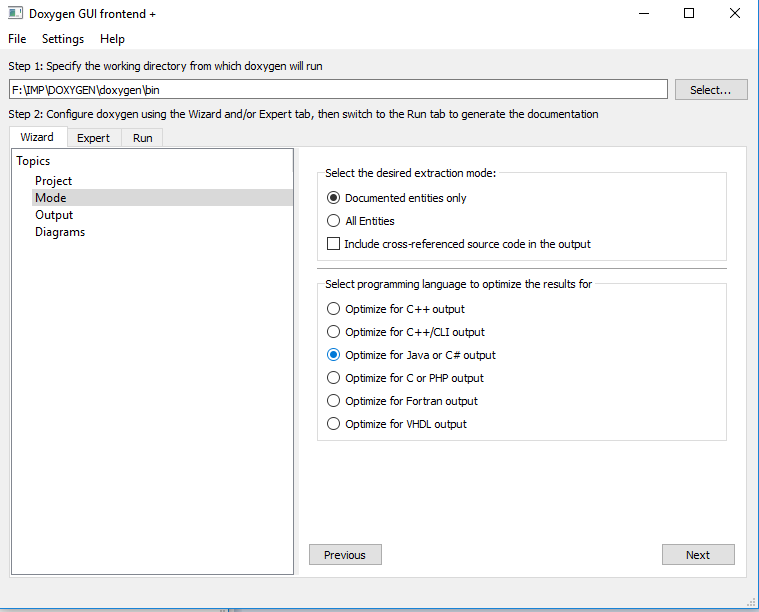
Then in the mode you need to select the source code type.Here i have selected C#.

Dox_5

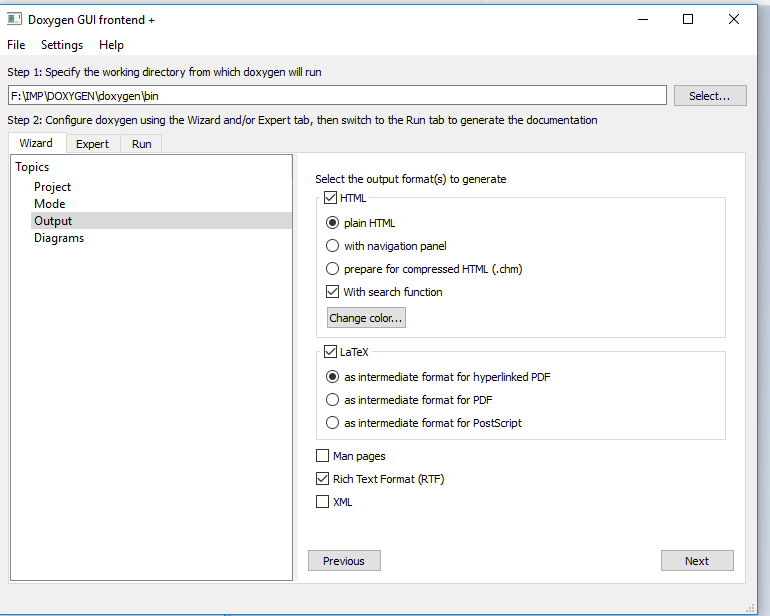
And in the output we can select multiple options .

Dox_6

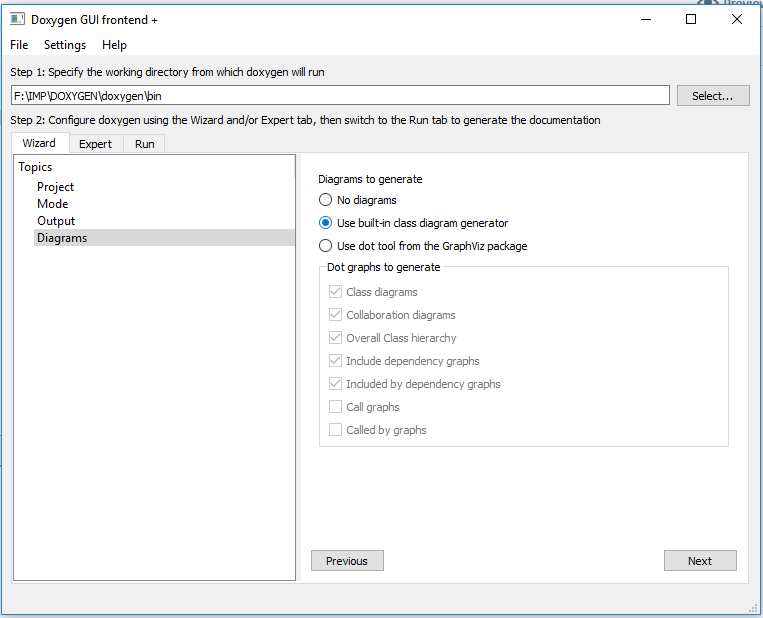
Also we can add diagrams in report using the diagrams tab.

Dox_7

Now we can run the doxygen.It will generate the document.

Dox_8After completing the execution we can check the output using the link -Show HTML output.

Dox_9.png

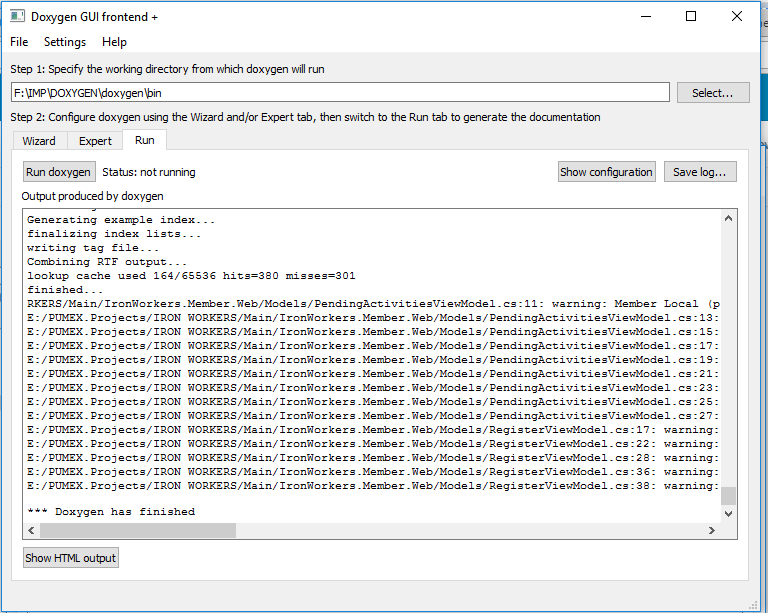
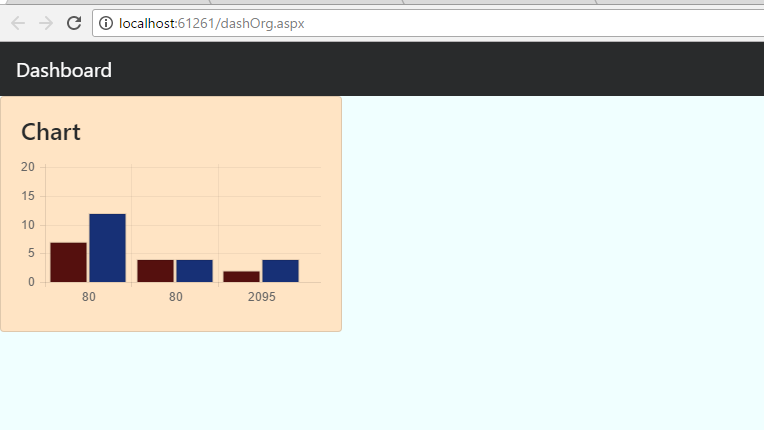
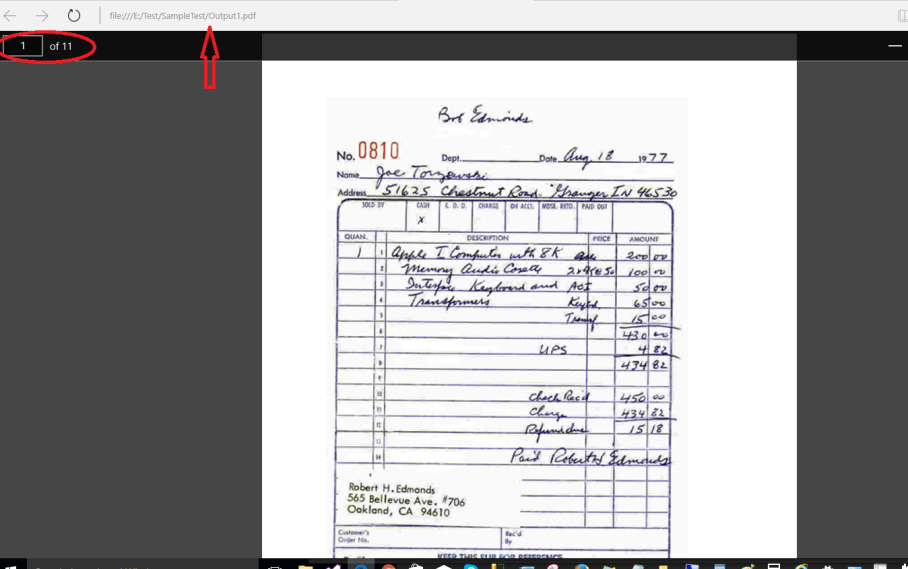
It will looks like this.

Dox_10

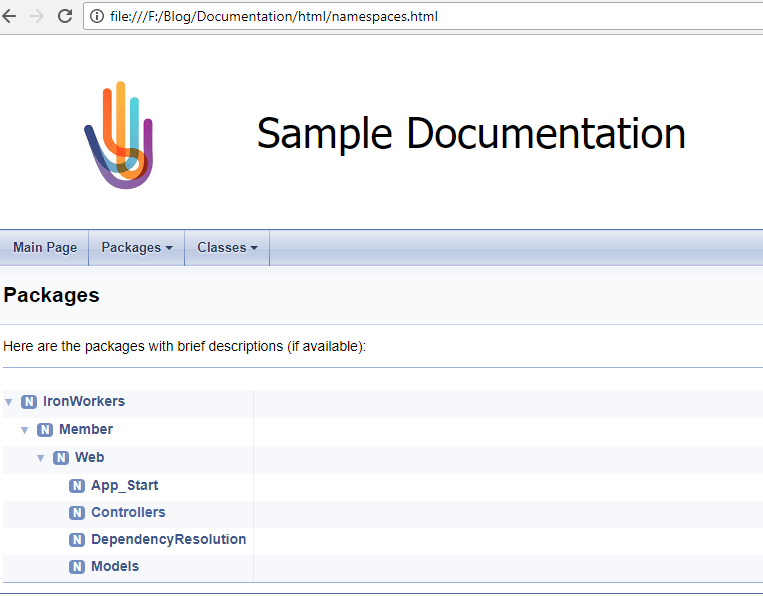
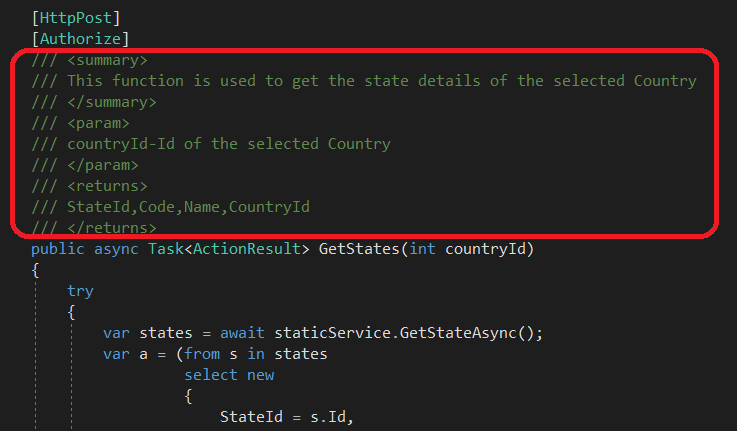
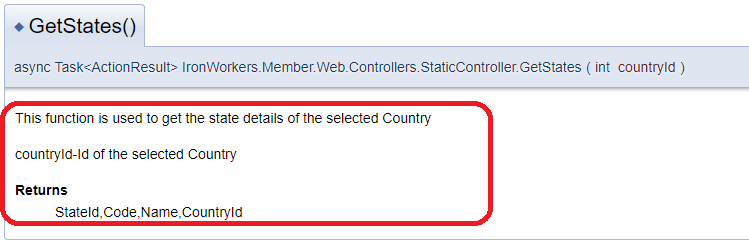
If we have added any comments in the program it will display here.

In this I have added some comments in one of the function in the controller.

Dox_11

Dox_12

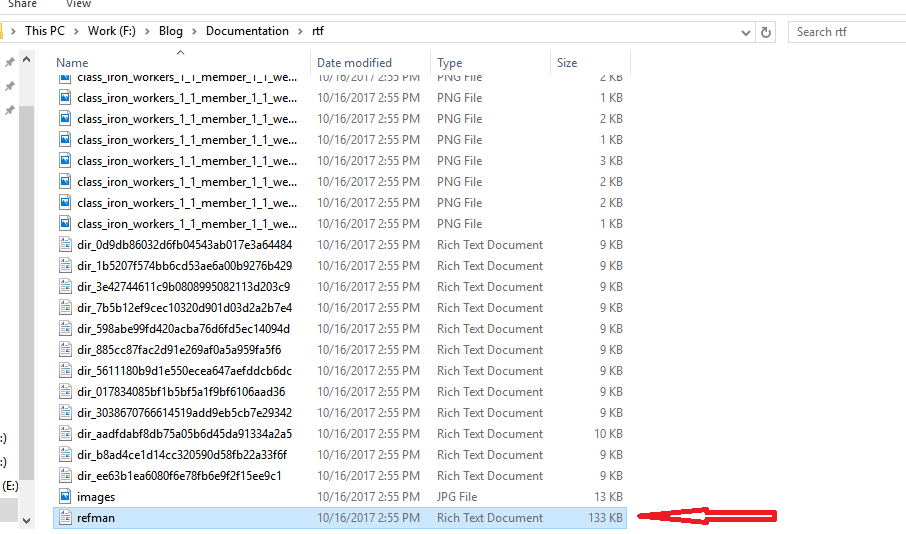
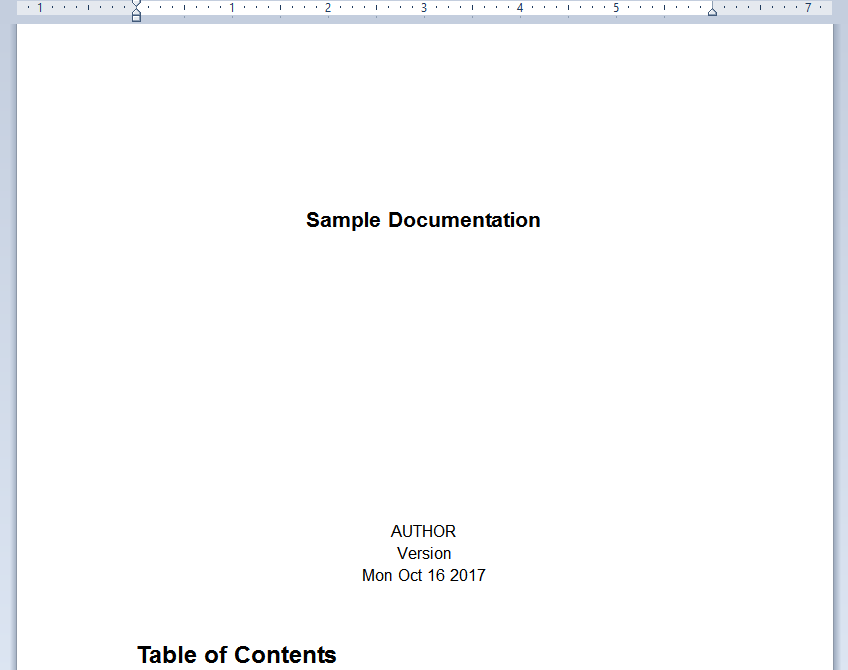
Also we can get the word document generated by the doxygen .This will be saved in the selected destination folder.

Dox_14

Let’s see the output.

Dox_13

For more information please visit  http://www.doxygen.org/

Thank You!!!!

Create charts using ChartJs

The JavaScript library Chart.js is an open source project created by Nick Downie in 2013.

ChartJS is a library-based on javascript and HTML5. The main foundation of this library is <canvas> element in HTML5.

A great way to get started with charts is with ChartJs, a JavaScript plugin that uses HTML5’s canvas element to draw the graph onto the page. It’s a well documented plugin that makes using all kinds of bar charts, line charts, pie charts etc.

ChartJS is a powerful, dependency free JavaScript library which builds graphs via the canvas element.

The great things about ChartJs are that it’s simple to use and really very flexible.

Here I want to share the steps to display a barchart in my MVC application.The value of chart will vary based on the provider and date  filter.

ChartJS uses the canvas element. The basic pattern is to create the canvas element in HTML, select it with JavaScript, and create the Chart while passing in the data the chart is built from.

We can customize the ChartJs library to create whatever chart you visualize. The library provides six basic designs by default.

  • Line: Show your data as the peaks and valleys of a line graph.
  • Bar: Demonstrate trends with many different shaped bars.
  • Radar: Present data just like your local meteorologist.
  • Pie: Present data as slices of the overall circle.
  • Polar area: It’s easier to quote the documentation on this chart as it is similar to pie charts. The variable isn’t the circumference of the segment, but the radius of it.
  • Doughnut: Think of a pie chart that is presented in a doughnut shape. The inner circle or hole in the middle is customizable.

The base of everything is the Chart object, which contains methods for creating and manipulating the chart types. Using the Chart object is a simple process. The following steps provide the basic approach to creating charts using the library.

  1. Include the Chart.js library in the web page.
  2. Create a Canvas element within the web page.
  3. In script, obtain the context of the Canvas element.
  4. Assemble data to be used to fill the Chart.
  5. Create the chart via script — pass context element to Chart and individual methods to create chart type (data and options passed via method).


The features and advantages chartjs.

  1. 100% responsive, so we do not have to worry and think about the look of our apps on all devices.
  2. 6 Chart type. We do not have to worry about running out of stock chart type, and our application will be perfect
  3. The size is only 110KB and free library dependencies with other libraries
  4. Fully tooltip, so that we can display a short information.
  5. Etc.

SETTING UP

The first thing we need to do is download ChartJs.  Then create a new html page and import the script:

DRAWING A BAR CHART

The first thing we need to do is create a canvas element in our HTML in which Chart.js can draw our chart. So add this to the body of our HTML page.

I’ll be using the CDN to include the library – using this script tag

 https://cdnjs.cloudflare.com/ajax/libs/Chart.js/2.1.4/Chart.min.js 

Need to add Canvas in our page.

<div>
<canvas id="chartcanvas"></canvas></div>


11

Similarly we can create different types of charts

LINE CHART

 var ctx = document.getElementById('myChart').getContext('2d'); var myChart = new Chart(ctx, { type: 'line', data: { labels: ['M', 'T', 'W', 'T', 'F', 'S', 'S'], datasets: [{ label: 'hours slept', data: [6.5, 5, 7, 7.5, 9, 10, 6], backgroundColor: "rgba(153,255,51,0.4)", }] } }); 

LineChart.png

PIE CHART

 var ctx = document.getElementById('myChart').getContext('2d'); var myChart = new Chart(ctx, { type: 'pie', data: { labels: ['Chrome', 'Safari', 'IE', 'Firefox', 'Other'], datasets: [{ backgroundColor: [ "#2ecc71", "#3498db", "#95a5a6", "#9b59b6", "#f1c40f" ], data: [40.7, 23.9, 15.3, 11, 9.1], }] } }); 


PieChart

LEARN MORE……..

There is so much more to learn about Chart.js.You can also check out the Chart.js homepage for more information about what it is and what you can do.

THANK YOU!!!!!!!!!


Create pdf using MigraDoc & PDFSharp

MigraDoc Foundation the Open Source .NET library that easily creates documents based on an object model with paragraphs, tables, styles, etc.It is a document generator. It supports almost anything we find in any good word processor. WE can add paragraphs, tables, charts, arrange all this in sections, use bookmarks to create links, tables of contents, indexes, etc. MigraDoc will create PDF or RTF documents.

PDFsharp is the Open Source .NET library that easily creates and processes PDF documents on the fly from any .NET language. The same drawing routines can be used to create PDF documents, draw on the screen, or send output to any printer. is a .NET library for processing PDF file. We can create PDF pages using drawing routines known from GDI+. Almost anything that can be done with GDI+ will also work with PDFsharp. Only basic text layout is supported by PDFsharp, and page breaks are not created automatically. The same drawing routines can be used for screen, PDF, or meta files.

Use PDFSharp or MigraDoc?

  • Use PDFsharp if we  want to create PDF files only, but be able to control every pixel and every line that is drawn.
  • Use MigraDoc if we need documents as PDF and RTF files and if we want to enjoy the comfort of a word processor.
  • Mixing PDFsharp and MigraDoc

    If MigraDoc does almost anything we need, then we can use MigraDoc to create PDF files and post-process them with PDFsharp to add some extra features.

    Use PDFsharp to create the document but use MigraDoc to create individual pages. This could be the best choice if our application uses lots of graphics, but also needs some layouted text.

     PDFsharp’s features

    • Creates PDF documents on the fly from any .NET language
    • Easy to understand object model to compose documents
    • One source code for drawing on a PDF page as well as in a window or on the printer
    • Modify, merge, and split existing PDF files
    • Images with transparency (color mask, monochrome mask, alpha mask)
    • Newly designed from scratch and written entirely in C#
    • The graphical classes go well with .NET

     MigraDoc’s Features

    • Create perfect documents “on the fly”
    • Import data from various sources via XML files or direct interfaces (any data source that can be used with .NET)
    • Supports different output formats (PDF, Word, HTML, any printer supported by Windows)
    • Integrates easily with existing applications and systems
    • Various options for page layout, text formatting, and document design
    • Dynamic tables and business charts
    • Re-usable building blocks consisting of text and / or code

PDFsharp and MigraDoc Foundation Downloads

Here i am going to explain how to convert an image into pdf of small size.

I’ve an image file of size 625KB, i need to convert that to pdf.I’m using

  • Visual studio 2015
  • .Net Framework 4.6.2

Step1:Creating a new Web Application

Click New Project from the Start page.When the New Project dialog box is displayed, expand Visual C# in the list of templates, then click Web, and select ASP.NET Web Application. Name our project SamplePDF and then click OK:

1

2.PNG

Step 2: Install PDFSharp & MigraDoc GDI

3

Now the reference should contains:

4

Step3: Add new webform and named it as Home.aspx.

5.png

6

Here I’m adding a button to create pdf.

Home.aspx :

<%@ Page Language="C#" AutoEventWireup="true" CodeBehind="Home.aspx.cs" Inherits="SamplePDF.Home" %>

<!DOCTYPE html>

<html xmlns="http://www.w3.org/1999/xhtml">
<head runat="server">
    <title></title>
</head>
<body>
    <form id="form1" runat="server">
<div>
            <asp:Button ID="btnCreate" Text="Create PDF" runat="server" OnClick="btnCreate_Click" /></div>
</form>
</body>
</html>

Create a folder named test to store the output and images.Use the corresponding path in code.

folder

Home.aspx.cs :

using System;
using MigraDoc.DocumentObjectModel;
using MigraDoc.Rendering;
using PdfSharp.Pdf;
using System.Collections.Generic;
using System.Diagnostics;
using System.IO;
using System.Linq;
using System.Web;
using System.Web.UI;
using System.Web.UI.WebControls;
using PdfSharp.Drawing;

namespace SamplePDF
{
    public partial class Home : System.Web.UI.Page
    {

        protected void Page_Load(object sender, EventArgs e)
        {

        }

        protected void btnCreate_Click(object sender, EventArgs e)
        {
            Document document = CreateDocument();
            document.UseCmykColor = true;
            const bool unicode = false;
            const PdfFontEmbedding embedding = PdfFontEmbedding.Always;
            PdfDocumentRenderer pdfRenderer = new PdfDocumentRenderer(unicode, embedding);
            pdfRenderer.Document = document;

            pdfRenderer.RenderDocument();

            // Save the document...
            const string filename = "Output1.pdf";
            pdfRenderer.PdfDocument.Save(@"E:Test\SampleTest\" + filename);
            // ...and start a viewer.
            Process.Start(@"E:Test\SampleTest\" + filename);
        }
        public static Document CreateDocument()
        {
            // Create a new MigraDoc document
            Document document = new Document();

            // Add a section to the document
            Section section = document.AddSection();

            // Add a paragraph to the section
            Paragraph paragraph = section.AddParagraph();

            document.LastSection.LastParagraph.AddImage(@"E:Test\1.jpg");

            var para = document.LastSection.AddParagraph();
            para.AddImage(@"E:Test\1.jpg");
            para.AddImage(@"E:Test\1.jpg");
            para.AddImage(@"E:Test\1.jpg");
            para.AddImage(@"E:Test\1.jpg");
            para.AddImage(@"E:Test\1.jpg");
            para.AddImage(@"E:Test\1.jpg");
            para.AddImage(@"E:Test\1.jpg");
            para.AddImage(@"E:Test\1.jpg");
            para.AddImage(@"E:Test\1.jpg");
            para.AddImage(@"E:Test\1.jpg");

            return document;
        }

    }
}

Output :

output

In this i’m using only 6 images to convert.So the actual size of the image is 625KB after converting into PDF it’s 69KB.
                                                          THANK YOU…………………

Create and share forms with Wufoo….

What’s Wufoo?

Wufoo is a web application that helps us to  build amazing online forms up and running within minutes. When we design a form with Wufoo, it automatically builds the database, backend and scripts needed to make collecting and understanding our data easy, fast and fun. Intuitive drag and drop functionality Over 150 templates to choose from Easy to embed forms Easy payment setup ability.It makes great use of ajax to create a very nice user experience on the admin side of things. We can place our finished form in either an embedded iframe  or on a dedicated web page. We can receive new responses by email or RSS, response data can be filtered and displayed in a variety of ways in the reports section and there is easy control over the look and feel of the forms our users interact with. Form creation is an important function and the team behind Wufoo has leveraged some of the best in contemporary technology. Wufoo forms allow us to gather, analyze, and recall data that is lost or never recorded with traditional email systems.Use Wufoo’s online order forms to collect details about the order, gather the customer’s contact info, and even collect payments.

The Mythology:

Chris Campbell, Kevin Hale and Ryan Campbell founded Wufoo in 2006 on the belief that forms were the starting point for building anything useful on the web.

In 2011, Wufoo was acquired by SurveyMonkey, the leader in web-based survey solutions, to help complement their growing suite of services to offer amazing data collections tools to their customers.

What’s with the name?

Kevin really likes the Wu-Tang Clan and Foo Fighters.

Features:

  • Easy
  • Fast
  • Secure
  • Portable
  • Affordable
  • No long term contracts.

Let’s start creating a form with Wufoo…..

First step is to login to the website http://www.wufoo.com

www

If you are not a member create an account.It’s free.Then login to our account & create new form.

newform

Field Types:

Fields are the building blocks of forms—they l collect data from the people who fill out our form. There are lots of field types we can add to our form so we can collect the right kind of data, in the right format.

We can add fields from the Form Builder.

fields

etc..

We can change the form name using Form settings tab.

formsettings

Add  fields in the form using Add a Field tab & style the form using CSS. Mandatory fields can be set by using required options in the Field settings tab.

addfield1


Once we add the field we can change the field names and other properties using Field Settings tab. Also we can add and delete the fields using ‘+’ and ‘-‘ buttons in the right corner of the fields.

fieldsettings

For changing the theme click on Forms tab select the dropdown as shown in fig:

theme

Configure email :Form Manager->Edit->Add Notifications.

emailnotification


In this form I am trying to receive the content as plain text.So we can enable that option in Customize Notification Email->Send Emails in Plain Text.

plaintext

To publish the form,share this  link:

sharelink

Now  Copy and paste the link to use….

form_final


After submitting the form,we can receive the e-mail like this.

email


Thank You…..